Originally posted on May 19, 2023 at 9:58:34am
Message modified by krindorr on May 19, 2023 at 10:01:16am
- Bio page
- krindorr
- Joined
- Oct 5, 2020
- Last login
- Sep 20, 2024
- Total posts
- 18,952 (115 FO)
Messages
Time
5/16/23 8:16am
5/16/23 1:09pm
5/16/23 1:55pm
5/16/23 8:28am
5/16/23 8:36am
5/16/23 9:45am
5/16/23 8:42am
5/16/23 8:58am
5/16/23 11:58am
5/16/23 12:39pm
5/16/23 12:53pm
5/16/23 1:15pm
5/16/23 9:44am
5/16/23 1:43pm
5/16/23 1:54pm
5/16/23 4:11pm
5/16/23 9:13am
100% it's a simple back-of-the envelope calculation, useful as a starting point. But I don't see importance of # alumni
5/16/23 9:26am
IMO, TV ratings shouldn't be so much about a set number but more about how teams perform against the
5/16/23 10:28am
5/16/23 10:43am
5/16/23 11:59am
5/16/23 12:55pm
5/16/23 1:40pm
5/16/23 1:41pm
5/16/23 2:04pm
5/16/23 4:06pm
5/16/23 6:21pm
5/16/23 6:57pm
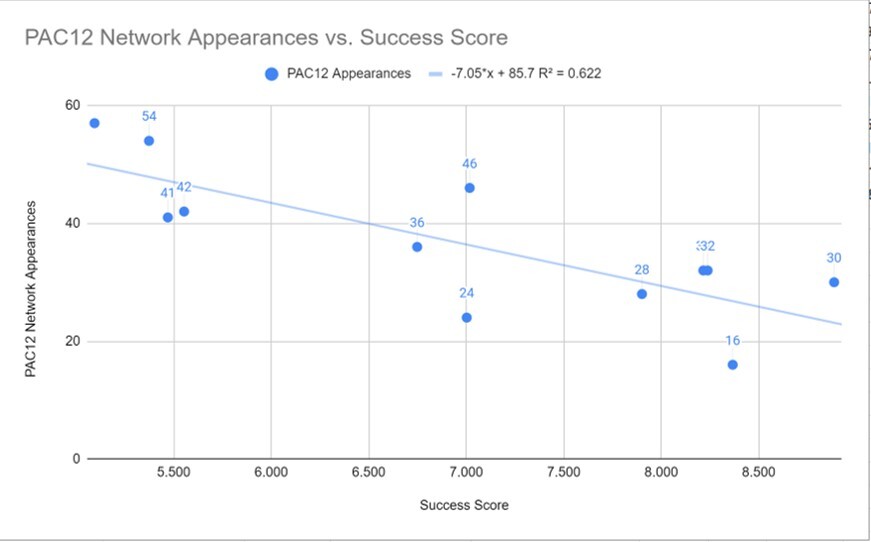
Ok, let's take it by year and see if we can't figure this out: PAC 12 Network games by year for the last decade
5/17/23 8:27am
5/17/23 11:22am
5/18/23 11:28pm
5/19/23 9:58am
5/17/23 9:37am