I was trying to come up with a better process to rank college football teams. Here's a proposal - wins above/below 20th ranked team.
Process - using some rating system (I used Sagarin), identify the 20th ranked team. Then, for each team individually, calculate expected win % that the 20th ranked team would have against the schedule that team played. You can then determine a projected record for the 20th ranked team vs that schedule. Compare the actual wins the team got vs the projected wins for that team, and that becomes the wins above/below the 20th ranked team.
What does this accomplish?
1 - In my opinion winning the game is the most important thing, and this rewards winning the games placed in front of you.
2 - This rewards winning against harder teams more than winning against easier teams. If you play an FCS school the 20th ranked team would have maybe a 98% probability of winning that game - so when you win you only gain .02 points vs the expected win percentage. If you play a top ranked opponent and the 20th ranked team would only have a 30% probability of winning that game, if you win you get 0.7 points vs expected win (and if you lose you only give up 0.3 points).
3 - It rewards/punishes you based on the location of the game. You will have a higher likelihood of winning a home game than a road game - and the percentages account for that.
I did this for teams this season. One other modification I made - for any team in a conference championship game, I excluded the game if they lost and included the game if they won. I think winning a conference championship should mean something - but don't think it is right to punish someone for an extra game when others are just sitting.
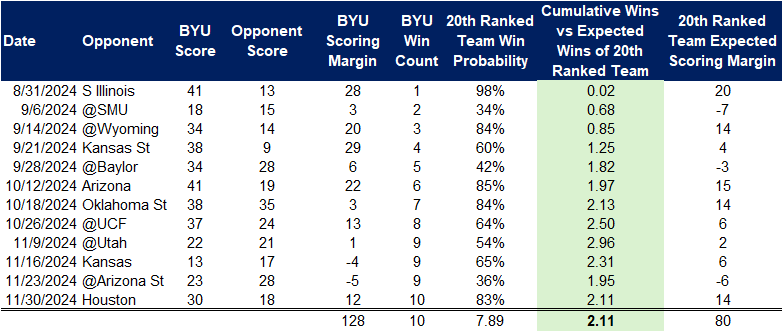
So, as an example, let's look at BYU. Chart below shows their schedule, the projected probability of win of the 20th ranked team (along with expected spread), and what BYU's actual results were. The first game, vs S Illinois, the 20th ranked team would have had a 98% probability to beat them at home. BYU got the victory - so comparing their actual wins vs expected for the 20th ranked team - the light green column shows that they were +.02 points for that game (essentially no benefit). But, the next game, when they beat SMU, there was only a 34% chance the 20th ranked team would have won - so after the first two games BYU was +0.68 wins vs what would be expected. Overall, they finished with 2.1 more wins than would have been expected.
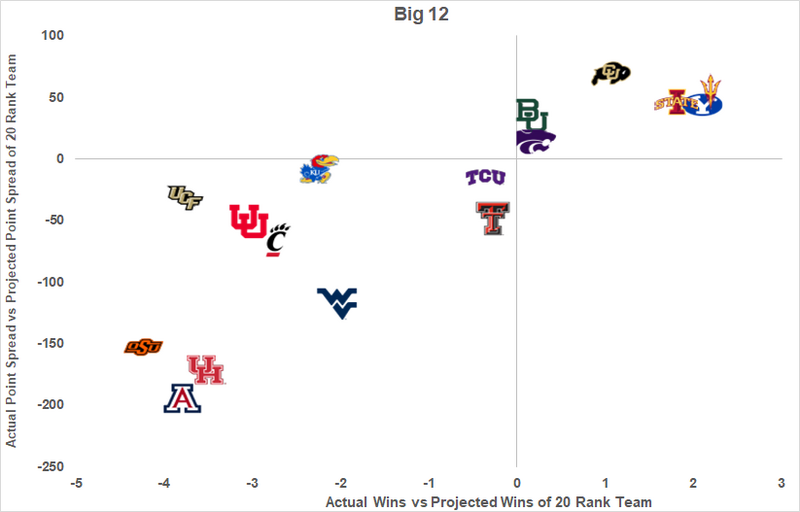
If you do that for all Big 12 teams, and chart based on wins vs expected and scoring margin vs expected, here's what that chart looks like. The further to the right you go, the more wins you had vs your schedule than the 20th ranked team would have been expected to have. The higher up you go, the larger your scoring margin vs what would have been expected.
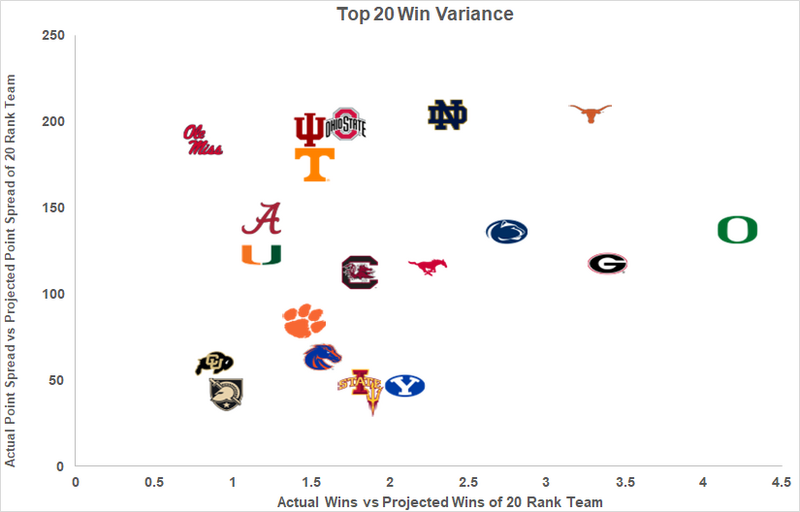
If you do the same for the top 20 teams (all conferences) based on the win variance vs expected for the 20th ranked team, this is what that chart looks like:
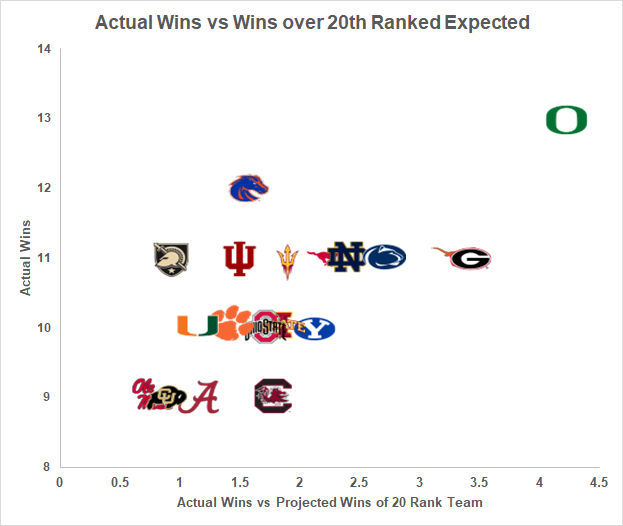
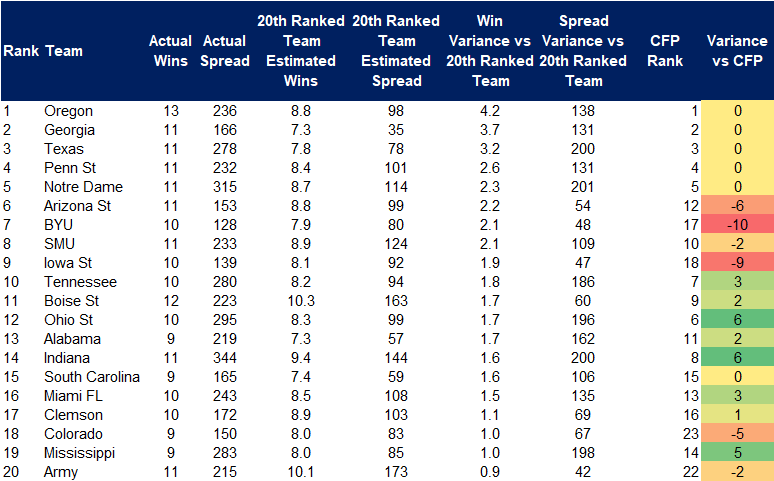
I was curious how closely this would align to just the pure # of wins each team had. There is actually quite a bit of variance for teams with the same # of wins. All teams along the same horizontal row had the same # of victories. The teams further right had a more difficult schedule while the ones to the left had an easier schedule. For 11 win teams - Georgia and Texas had hardest schedules and their 11 wins put them 3.5 above what you'd expect for the 20th ranked team, while Army had the easiest schedule and with 11 wins they were only 1 above what you'd expect. (Indiana next lowest for the 11 win teams, at 1.5 above).
If you ranked purely on the variance of wins vs the 20th ranked team, here is how the standings would look. And at the end is a comparison with how the official CFP rankings turned out. There were 4 teams who were underseeded by CFP by 5 or more spots if you buy this...ASU, BYU, ISU, and Colorado. See a pattern?
If you seeded the CFP according to this, here is what the bracket would look like:
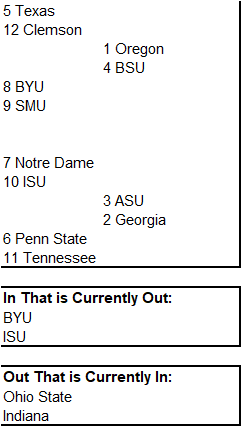
This would never fly with Ohio State being the first team out...
Thoughts/reactions?